Evolution & microbiome
Nayancode Microbiome Studio
Diversity, ordination and differential abundance, done properly.
Amplicon feature tables to alpha and beta diversity, UniFrac, PCoA, PERMANOVA, CLR differential abundance and rarefaction.
Free · runs in your browser · nothing uploaded
Overview
What Microbiome Studio does
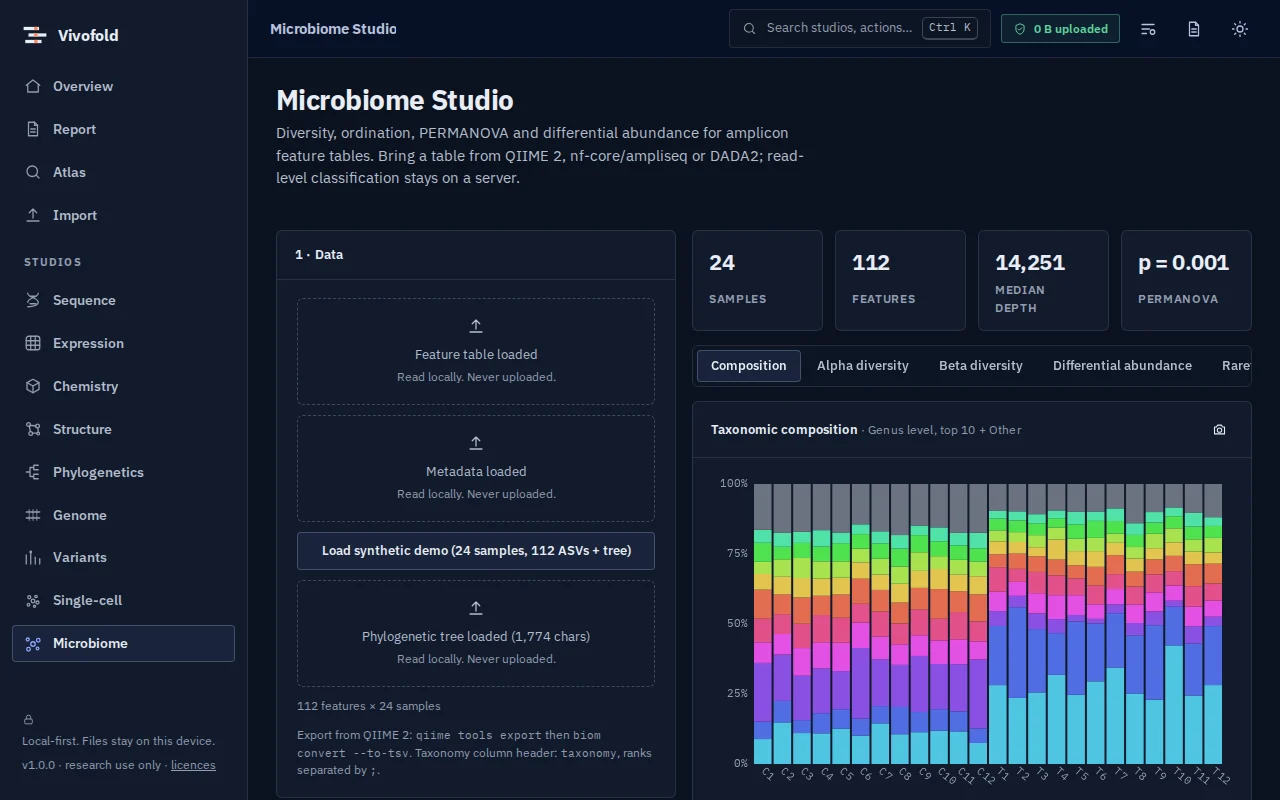
Microbiome Studio analyses amplicon feature tables with the methods microbial ecologists rely on: alpha diversity, Bray–Curtis and weighted or unweighted UniFrac distances, PCoA ordination, PERMANOVA tests and rarefaction curves.
Differential abundance uses centred log-ratio transformation, which respects the compositional nature of sequencing data.
Technical specifications
- Inputs
- Feature table · Sample metadata · Newick tree (optional)
- Outputs
- Diversity tables · Ordination plots · PERMANOVA results · DA tables
- Engine
- TypeScript kernels in a Web Worker
- Platforms
- Chrome, Edge, Firefox and Safari (current versions) · Windows, macOS, Linux and ChromeOS · No installation, no account, no upload
- Limits
- Amplicon-scale feature tables
- Licence
- Free during the public preview; institutional licences on request
Features
Capabilities
Alpha and beta diversity
Richness, Shannon and Simpson; Bray–Curtis and Jaccard distances.
UniFrac
Weighted and unweighted UniFrac with a phylogenetic tree.
Ordination and tests
PCoA with PERMANOVA on any metadata variable.
Compositional DA
CLR-based differential abundance.
Rarefaction
Curves to judge sequencing depth.
Use cases
Who uses it, and for what
- Comparing microbial communities between conditions
- Teaching microbiome analysis
- Quick exploration before a QIIME 2 workflow
Documentation
Quick start
Open Microbiome Studio
Use the button on this page or the Workbench menu. Nothing to install; works in current Chrome, Edge, Firefox and Safari.
Load data or the demo
Drop in your files (Feature table, Sample metadata, Newick tree (optional)) or load the labelled synthetic demo to explore safely.
Run and inspect
Results appear as interactive figures and tables; each analysis records its parameters and versions.
Export and cite
Export figures and tables, add them to a report, and copy the auto-written methods paragraph.
Learn the methods with Vedicgen
Courses that use Microbiome Studio
Talk to us
Request a demo or ask a question
For classroom use, self-hosted deployments, custom studios or support. We reply within two working days.
Public preview: Free
Academic & teaching: Free for classrooms
Institutional & enterprise: On request