Chemistry & structure
Nayancode Structure Studio
Proteins and ligands in 3D, with the measurements that matter.
Mol* viewing of PDB and AlphaFold structures with an interaction profiler, pocket detection, SASA and superposition with TM-score.
Free · runs in your browser · nothing uploaded
Overview
What Structure Studio does
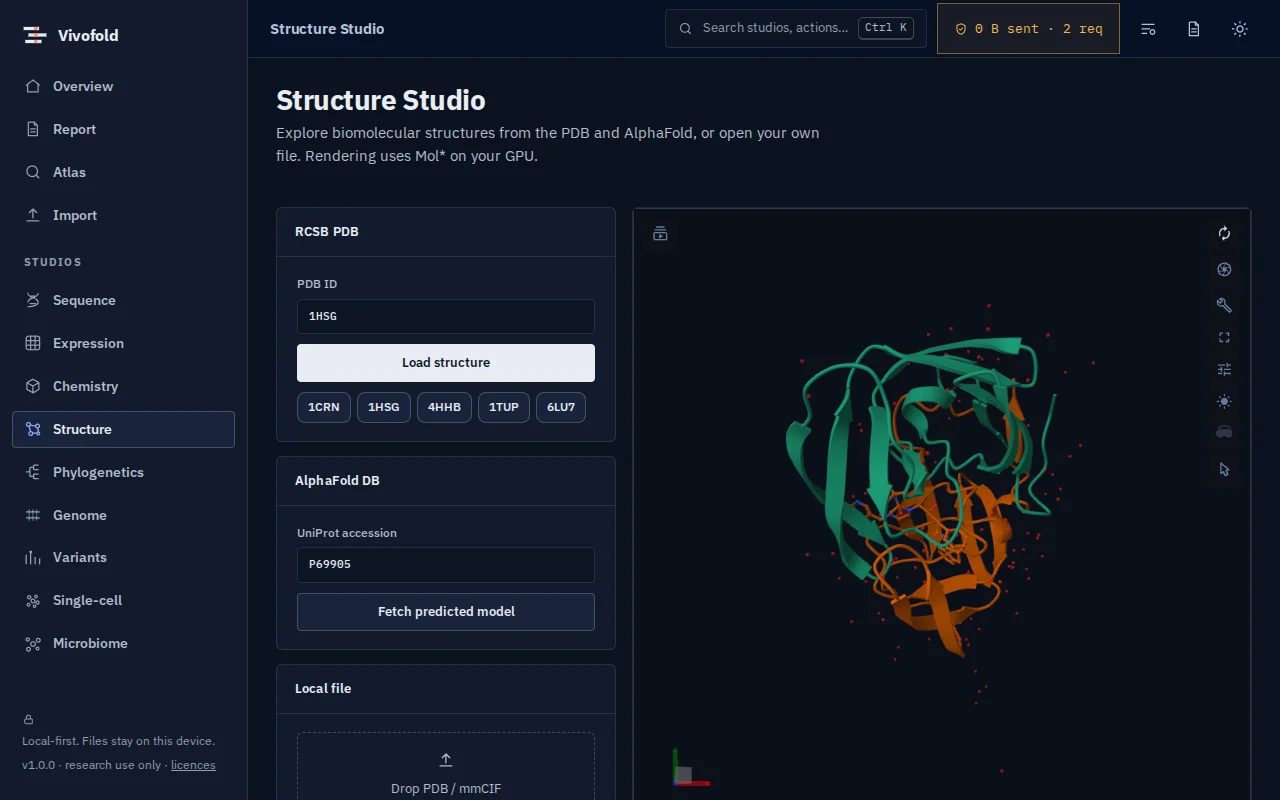
Structure Studio combines the Mol* viewer with analysis: load any PDB entry, an AlphaFold model by UniProt ID or your own file, and profile protein–ligand interactions, detect pockets, compute solvent-accessible surface area and superpose structures with RMSD and TM-score.
It is validated on the classic HIV-1 protease–inhibitor complex (PDB 1HSG) and documents its limits plainly: heavy-atom geometry only, and a heuristic pocket score.
Technical specifications
- Inputs
- PDB ID · UniProt ID (AlphaFold) · PDB / mmCIF files
- Outputs
- Interaction tables · Pocket lists · SASA tables · Superposition statistics and images
- Engine
- Mol* (WebGL) + TypeScript kernels
- Platforms
- Chrome, Edge, Firefox and Safari (current versions) · Windows, macOS, Linux and ChromeOS · No installation, no account, no upload
- Limits
- Heavy-atom geometry only; pocket score is heuristic, not a druggability model
- Licence
- Free during the public preview; institutional licences on request
Features
Capabilities
Mol* viewer
Publication-quality 3D views of structures and complexes.
Interaction profiler
Hydrogen bonds, hydrophobic contacts, salt bridges and π interactions.
Pocket detection
Grid-based pocket finding to suggest binding sites.
SASA
Per-residue and total solvent-accessible surface area.
Superposition
Kabsch superposition with RMSD and TM-score.
Use cases
Who uses it, and for what
- Inspecting a docking pose
- Comparing a predicted model with an experimental structure
- Teaching structural biology
Documentation
Quick start
Open Structure Studio
Use the button on this page or the Workbench menu. Nothing to install; works in current Chrome, Edge, Firefox and Safari.
Load data or the demo
Drop in your files (PDB ID, UniProt ID (AlphaFold), PDB / mmCIF files) or load the labelled synthetic demo to explore safely.
Run and inspect
Results appear as interactive figures and tables; each analysis records its parameters and versions.
Export and cite
Export figures and tables, add them to a report, and copy the auto-written methods paragraph.
Learn the methods with Vedicgen
Courses that use Structure Studio
Talk to us
Request a demo or ask a question
For classroom use, self-hosted deployments, custom studios or support. We reply within two working days.
Public preview: Free
Academic & teaching: Free for classrooms
Institutional & enterprise: On request