Evolution & microbiome
Nayancode Phylogenetics Studio
Alignments and trees, from neighbour-joining to maximum likelihood.
Multiple alignment, conservation, NJ and UPGMA with bootstrap, maximum-likelihood trees with model selection, Newick import and export.
Free · runs in your browser · nothing uploaded
Overview
What Phylogenetics Studio does
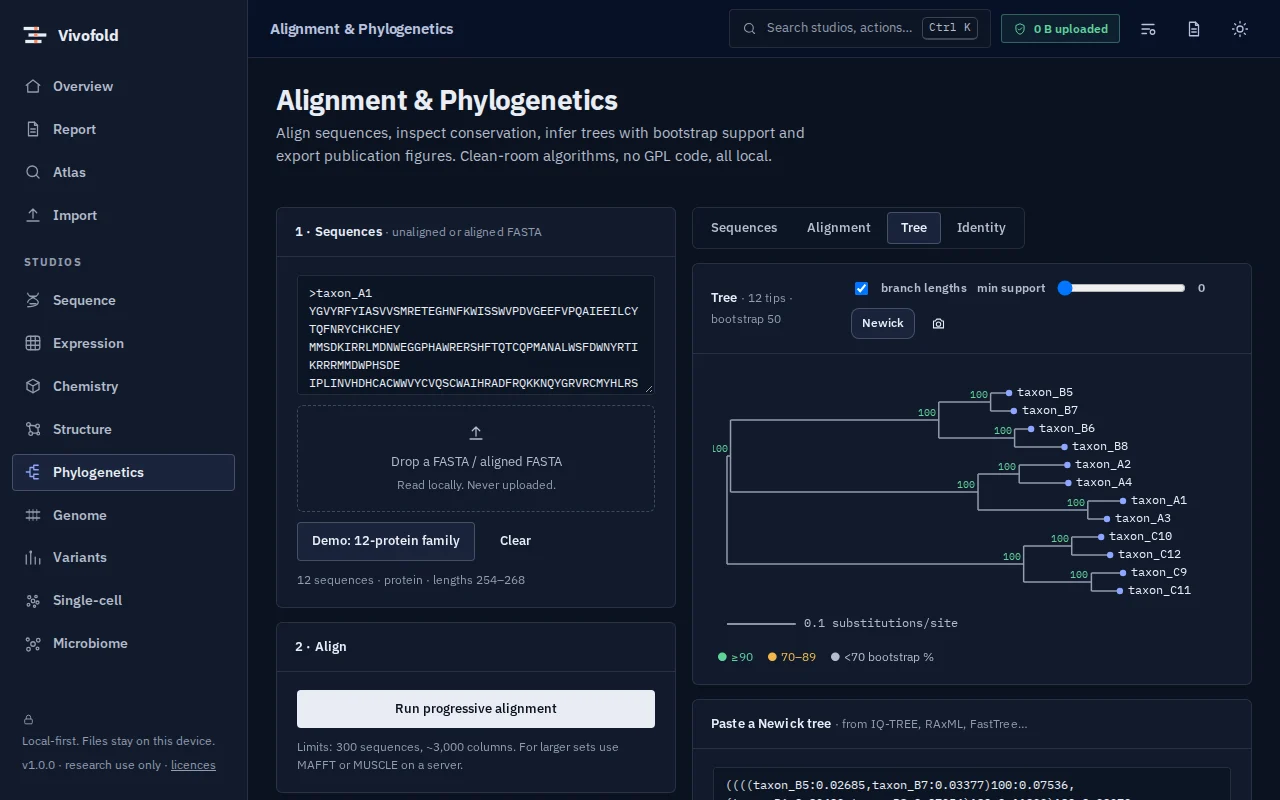
Phylogenetics Studio aligns sequences progressively, scores conservation and builds trees by neighbour-joining or UPGMA with bootstrap support, or by maximum likelihood under JC69, K80, HKY85 or Poisson models with optional gamma rate variation and AIC/BIC model selection.
Trees can be rooted, styled and exported as Newick or images for publication.
Technical specifications
- Inputs
- FASTA · Newick
- Outputs
- Alignments · Trees (Newick) · Tree figures · Model-selection tables
- Engine
- TypeScript kernels in a Web Worker
- Platforms
- Chrome, Edge, Firefox and Safari (current versions) · Windows, macOS, Linux and ChromeOS · No installation, no account, no upload
- Limits
- Maximum-likelihood trees up to 150 taxa (local NNI search); bootstrap runs in parallel on your CPU cores
- Licence
- Free during the public preview; institutional licences on request
Features
Capabilities
Multiple alignment
Progressive alignment with conservation scoring.
Distance trees
Neighbour-joining and UPGMA with bootstrap support.
Maximum likelihood
Nucleotide and protein models, gamma rates and AIC/BIC selection.
Tree figures
Rooting, styling and export.
Use cases
Who uses it, and for what
- Placing a new isolate in a phylogeny
- Teaching tree-building methods
- Quick trees for gene families
Documentation
Quick start
Open Phylogenetics Studio
Use the button on this page or the Workbench menu. Nothing to install; works in current Chrome, Edge, Firefox and Safari.
Load data or the demo
Drop in your files (FASTA, Newick) or load the labelled synthetic demo to explore safely.
Run and inspect
Results appear as interactive figures and tables; each analysis records its parameters and versions.
Export and cite
Export figures and tables, add them to a report, and copy the auto-written methods paragraph.
Learn the methods with Vedicgen
Courses that use Phylogenetics Studio
Talk to us
Request a demo or ask a question
For classroom use, self-hosted deployments, custom studios or support. We reply within two working days.
Public preview: Free
Academic & teaching: Free for classrooms
Institutional & enterprise: On request