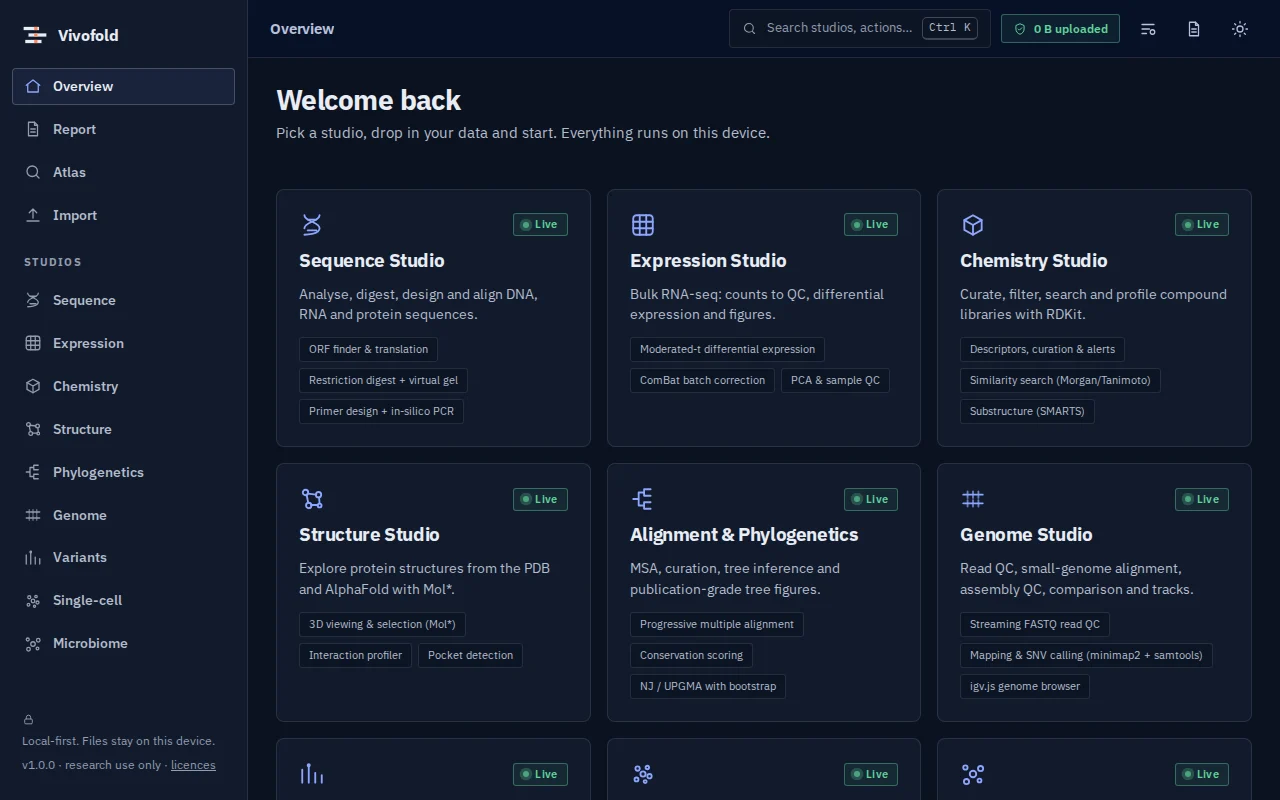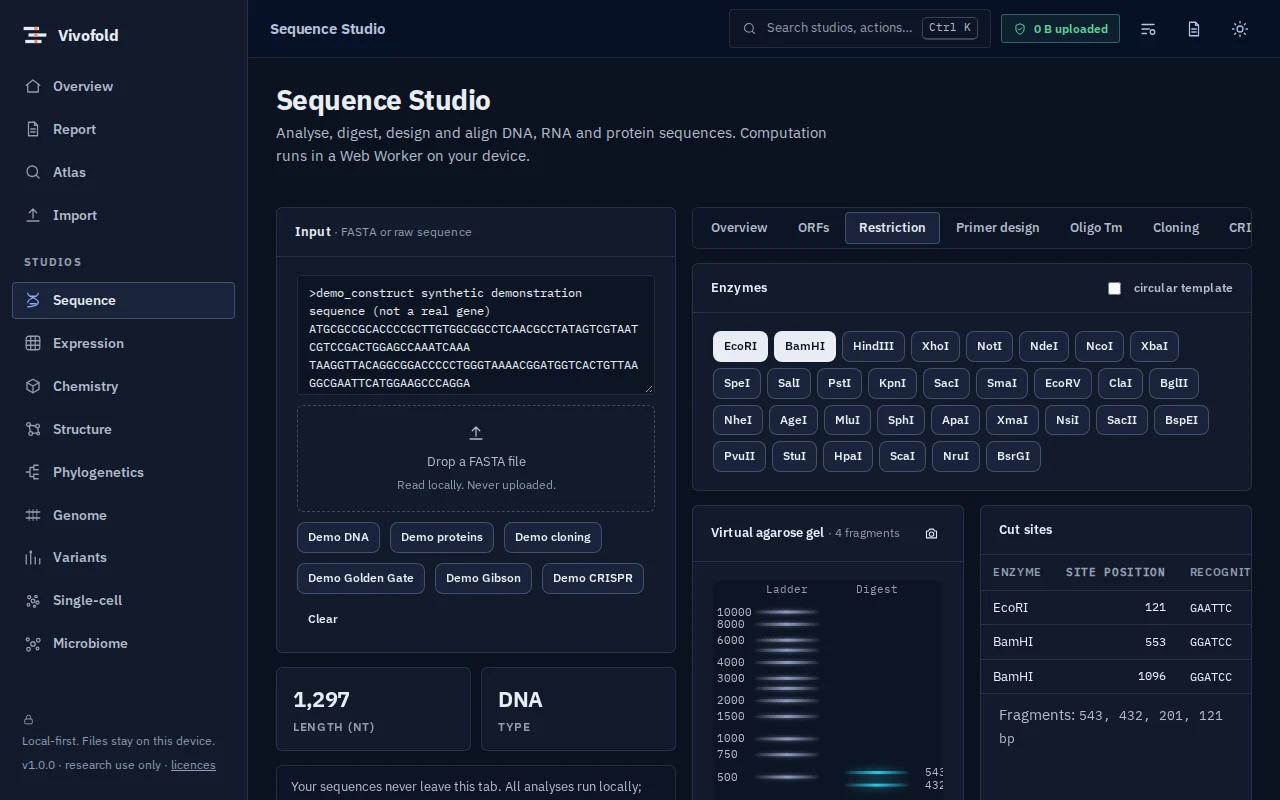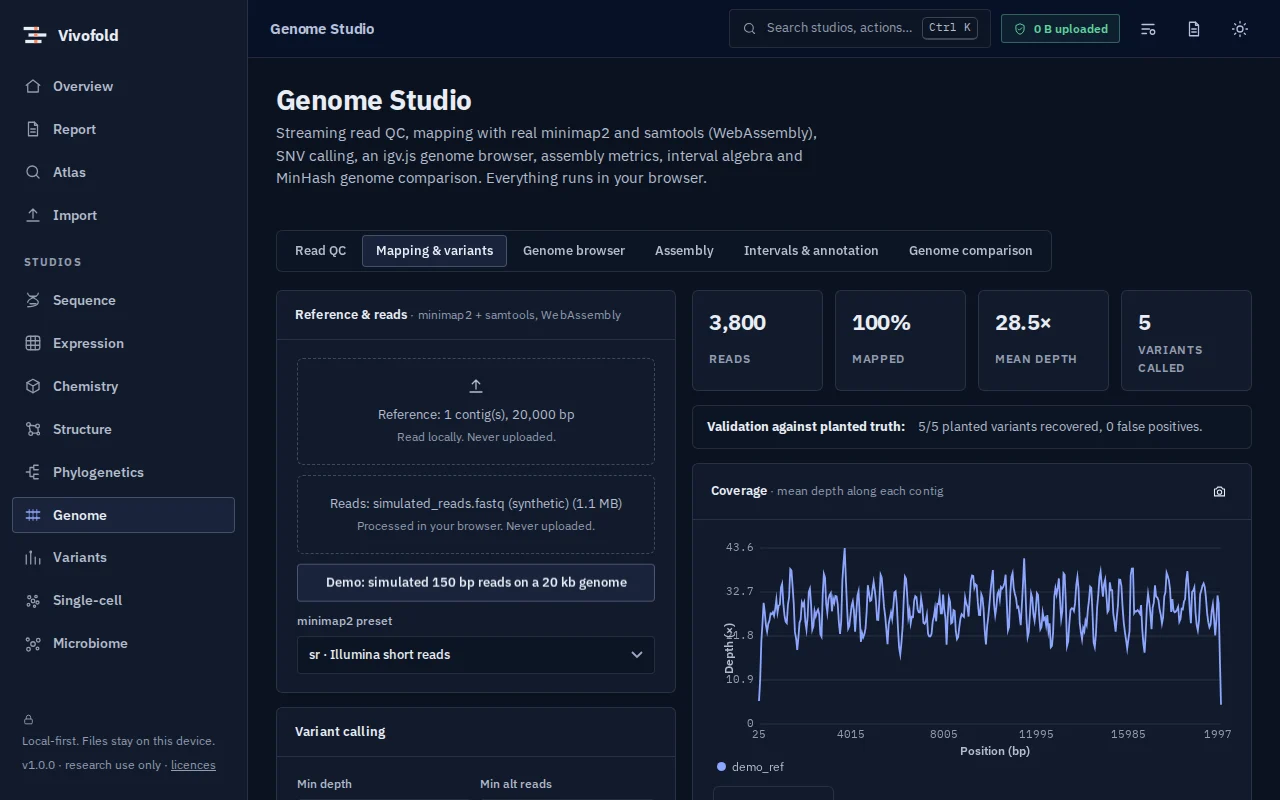
Genomics & transcriptomics
Nayancode Single-Cell & Spatial Studio
From matrix to annotated clusters, then into tissue space.
scRNA-seq QC, highly variable genes, PCA, graph clustering, UMAP or t-SNE, markers, annotation and spatial statistics.
Free · runs in your browser · nothing uploaded
Overview
What Single-Cell & Spatial Studio does
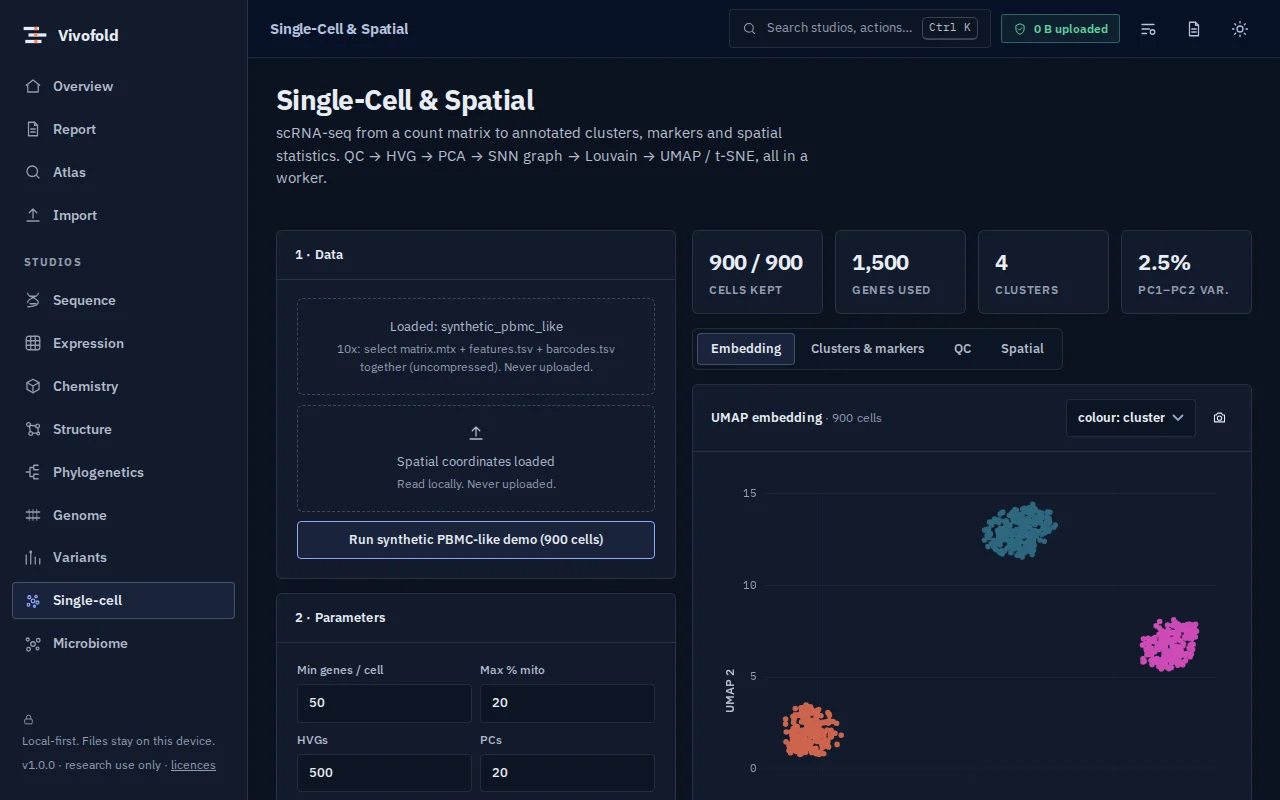
Single-Cell & Spatial Studio performs the standard single-cell workflow in your browser: cell QC, highly variable genes, PCA, shared-nearest-neighbour Louvain clustering, UMAP or t-SNE embeddings, marker genes and annotation.
Add spatial coordinates to compute spatial autocorrelation (Moran’s I) and see where clusters and genes sit in the tissue.
Technical specifications
- Inputs
- Count matrix · Spatial coordinates (optional) · 10x triplet (via Import)
- Outputs
- Cluster assignments · Embeddings · Marker tables · Spatial statistics
- Engine
- TypeScript kernels in a Web Worker
- Platforms
- Chrome, Edge, Firefox and Safari (current versions) · Windows, macOS, Linux and ChromeOS · No installation, no account, no upload
- Limits
- UMAP and t-SNE embed up to 3,000 cells by default; clustering uses all cells
- Licence
- Free during the public preview; institutional licences on request
Features
Capabilities
QC and feature selection
Counts, genes and mitochondrial fraction per cell; highly variable genes.
Clustering
SNN graph with Louvain community detection on all cells.
Embeddings
Clean-room UMAP and t-SNE implementations.
Markers and annotation
Ranked marker genes per cluster and manual annotation.
Spatial statistics
Moran’s I for spatially patterned genes.
Use cases
Who uses it, and for what
- Exploring a small single-cell dataset
- Teaching single-cell analysis
- Checking a 10x matrix from nf-core/scrnaseq
Documentation
Quick start
Open Single-Cell & Spatial Studio
Use the button on this page or the Workbench menu. Nothing to install; works in current Chrome, Edge, Firefox and Safari.
Load data or the demo
Drop in your files (Count matrix, Spatial coordinates (optional), 10x triplet (via Import)) or load the labelled synthetic demo to explore safely.
Run and inspect
Results appear as interactive figures and tables; each analysis records its parameters and versions.
Export and cite
Export figures and tables, add them to a report, and copy the auto-written methods paragraph.
Learn the methods with Vedicgen
Courses that use Single-Cell & Spatial Studio
Talk to us
Request a demo or ask a question
For classroom use, self-hosted deployments, custom studios or support. We reply within two working days.
Public preview: Free
Academic & teaching: Free for classrooms
Institutional & enterprise: On request